Published on November 14, 2013 | Posted in Front End
Different Charts Api
I recently worked on a project which required to build admin application which needed to produce some insight reports. Like most projects of this sort it required using a charting package. I decided to spend an hour with each one and build a basic bar chart. To see how each api performs.
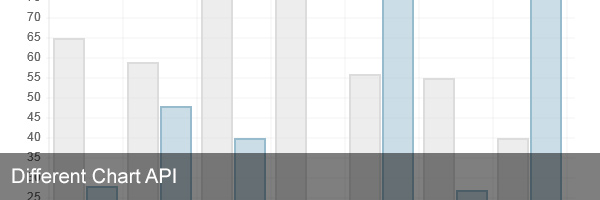
The charting api which I’m looking at is Google Chart, Chart.js, Flot and RapahelJs. The plan is to spend about around 1 – 2 hours. Looking at how I would create a simple bar chart showing how many moves are in each TAGB Taekwondo patterns.
Google Chart JS
“Google chart tools are powerful, simple to use, and free. Try out our rich gallery of interactive charts and data tools.”
The api gives you a wealth of different options in creating a chart. The Google chart api documentation is straightforward and easy to read. You can be up and running with little effort. The library is independent so you don’t need to worry about javascript library to install.
Url: Google Charts
Chart.Js
“Easy, object oriented client side graphs for designers and developers”
I like Chart.js a lot, the api is clean and straightforward to use. Chart.Js currently gives you six types of charts. All charts are well documented and gives you loads of customisable features. One of my favourite features of the api is the charts animate on load. The only downside I have found whilst doing my initial investigation is it doesn’t seem to have an hover on the tooltip.
Url: Chart Js
Flot
“Flot is a pure JavaScript plotting library for jQuery, with a focus on simple usage, attractive looks and interactive features.”
Of all the api’s I think I’m tending to lead toward this one for my project. While at first it took a while to get it to work as I was having difficulty getting the tooltips to work. I had to download additional plugin to get the tooltips to work. The api isn’t as easy to use as Google chart or Chart.js. This may be to the supporting documentation isn’t written as well the others. But after playing around with it I found it straight forward to use.
Url: Flot
RaphaelJs
“Raphaël is a small JavaScript library that should simplify your work with vector graphics on the web. If you want to create your own specific chart or image crop and rotate widget, for example, you can achieve it simply and easily with this library.”
Raphael isn’t a purpose built charting api and I think it shows for me to create a simple barchart required me to download some additional files to create the bar chart. I think this library needs a lot more time before you can get up and running but using this solution will give you most the customisation as Raphael will let you change every element on the chart. Looking over the demo on the site you can do some really good stuff with the api if you willing to invest time in learning it.
Url: Raphael